Summer 2010 — R: Summarization and Aggregation
| <- R: Basics | Home | R: Functions-> |
Contents
Intro
Raw data is usually useful in its static state. Therefore, it's important to have a good toolset for summarizing and aggregating data.
Basics
There are quite a few good summarization functions in base R. The simplest are
Briefly, I read 93 strings of 7 numbers formatted as telephone numbers (e.g. 123-4567).
The data is tab delimited, so we can load it with the following code.
dur <- read.delim("http://www.ling.upenn.edu/~joseff/rstudy/data/Joe.Durr1.txt")
table()
The
## How many of each number?
table(dur$Label)
##How many of each position?
table(dur$Pos)
##How many of each number in each position?
table(dur$Label, dur$Pos)
##Add some meaningful names to that table?
table(Label = dur$Label, Position = dur$Pos)
To get proportions in each cell of a table, wrap the
table(Label = dur$Label, Position = dur$Pos)
## Row-wise
prop.table(table(Label = dur$Label, Position = dur$Pos),1)
## Column-wise
prop.table(table(Label = dur$Label, Position = dur$Pos),2)
## Grand proporiton
prop.table(table(Label = dur$Label, Position = dur$Pos))
tapply()
The
## Geometric mean duration by number
exp(tapply(log(dur$Duration), dur$Label, mean))
## Median duration by number
tapply(dur$Duration, dur$Label, median)
## Total seconds spent on each number
tapply(dur$Duration, dur$Label, sum)
The nifty thing about
## Geometric mean duration by number by position
exp(tapply(log(dur$Duration), list(dur$Label, dur$Pos), mean))
## Sum of durations by number by position
tapply(dur$Duration, list(dur$Label, dur$Pos), sum)
Split Apply Combine
Frequently, you'll want to do something a bit more complex than
As the
The core of
| Structure | |
| array | |
| data frame | |
| list |
Most of the data structures we work with are data frames, and usually we'll want to keep working with data frames, so
data - The data frame containing the data.
variables - The variables to split the data frame up by.
fun - The function to apply to the data frame subsets.
The simplest function we can apply to an entire data frame and get meaningful results is
## Split by Label
ddply(dur, .(Label), nrow)
## Split by Pos
ddply(dur, .(Pos), nrow)
## Split by label and Pos
ddply(dur, .(Label, Pos), nrow)
You can also create variables on the fly to split the data frame by. For example, I could split the data on various binnings
of
## cut() Duration into 10 bins
ddply(dur, .(DurBins = cut(Duration, 10)), nrow)
## round() Duration to the nearest 1/10th second
ddply(dur, .(DurBins = round(Duration, 1)), nrow)
transform() and summarize()
Some other useful out-of-the-box functions to use with
transform()
## Subset of just "zero" in first position
sub01 <- subset(dur, Label == 0 & Pos == 1)
## transform duration to log centered
sub01 <- transform(sub01, Dur_center = log(Duration) - mean(log(Duration)))
After using
What if you wanted to apply this transformation to every subset of the data defined by unique combinations of
## Log center every subset defined by Label:Duration
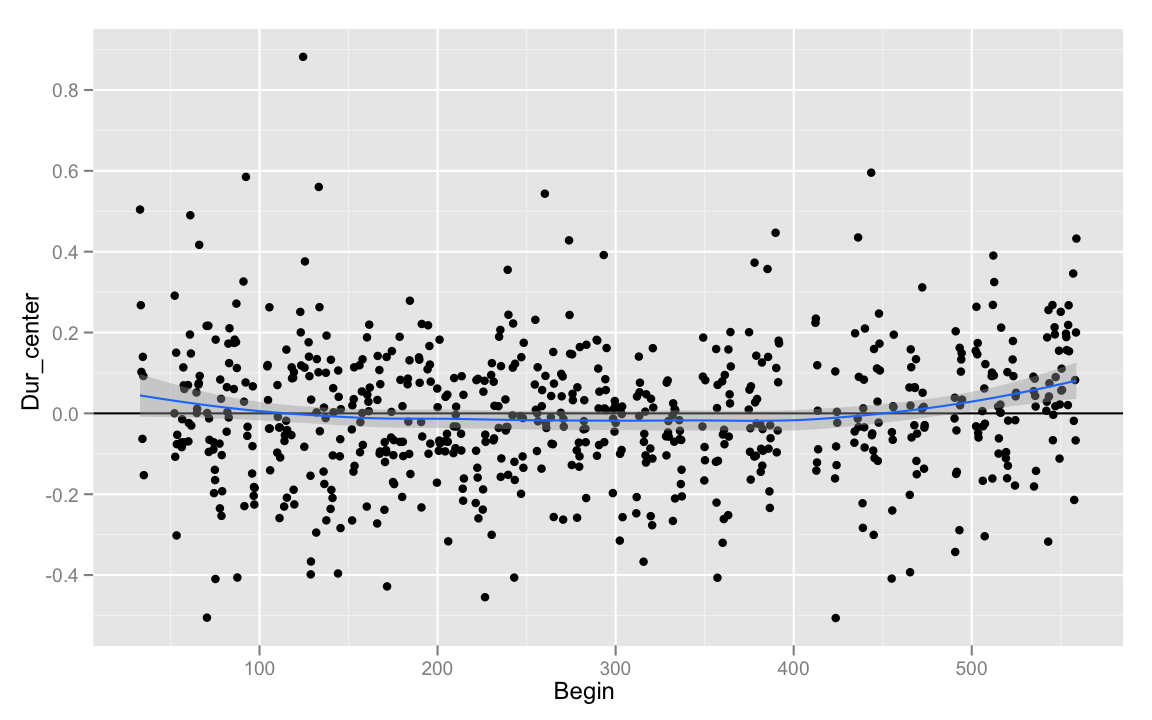
dur <- ddply(dur, .(Label,Pos), transform, Dur_center = log(Duration) - mean(log(Duration)))
Having applied this transformation, we could see how atypical a given recitation of a number in a given position is compared to some other variable (ideally, we'd use z-scores, or residuals for this). For example, how did my speech rate vary over the length of the recording?
summarize()
## summarise dur
summarise(sub01, Dur_mean = mean(Duration), Dur_sum = sum(Duration), Dumb = mean(end) - mean(Begin))
Rather than returning the entire original data frame with additional columns,
dur_summary <- ddply(dur, .(Label, Pos), summarize, Dur_mean = mean(Duration), Dur_sum = sum(Duration), Dumb = mean(end) - mean(Begin))
Arbitrary Functions
Repetition Example
You can also write your own arbitrary functions that take data frames as arguments, and pass them as arguments to
What if I wanted to test the hypothesis that if I read a number sequence where one of the numbers is immediately repeated (e.g. 123-4566),
the second repetition of the number will be shorter. Let's write a special function to be passed to
codeRepeat <- function(df){
  ## Make sure the dataframe is properly ordered
  df <- df[order(df$Pos),]

  ## If the difference between two adjacent labels
  ## is 0, they are the same label. The first label
  ## cannot have been a repeat.
  df <- transform(df, Repeat = c(NA, diff(df$Label) == 0))

  return(df)
}
Now, pass the
## apply the codeRepeat() function for every
## string of numbers, identified by Num
dur <- ddply(dur, .(Num), codeRepeat)
Now that we've got the data coded, it's only a matter of running the proper analysis.
mod <- lm(log(Duration) ~ factor(Pos)*factor(Label)*Repeat, data = dur)
anova(mod)
Florian Schwarz had an excellent suggestion for doing this same analysis quickly with data
that is coded as a factor. If
Normalization Example
I wrote this function to normalize formant data according to the ANAE method (there is also an ANAE normalization function in the
AnaeNormalize <- function(df, G = 6.896874, formants = c("F1","F2")){
  m <- length(formants)
  n <- nrow(df)

  S <-  sum( log(df[ , formants]) ) / (m*n)

  F <- exp(G - S)

  norm_formants <- paste(formants, "norm", sep = "_")

  for(i in seq(along = formants)){
    df[[ norm_formants[i] ]] <- df[[ formants[i] ]] * F
  }

  return(df)
}
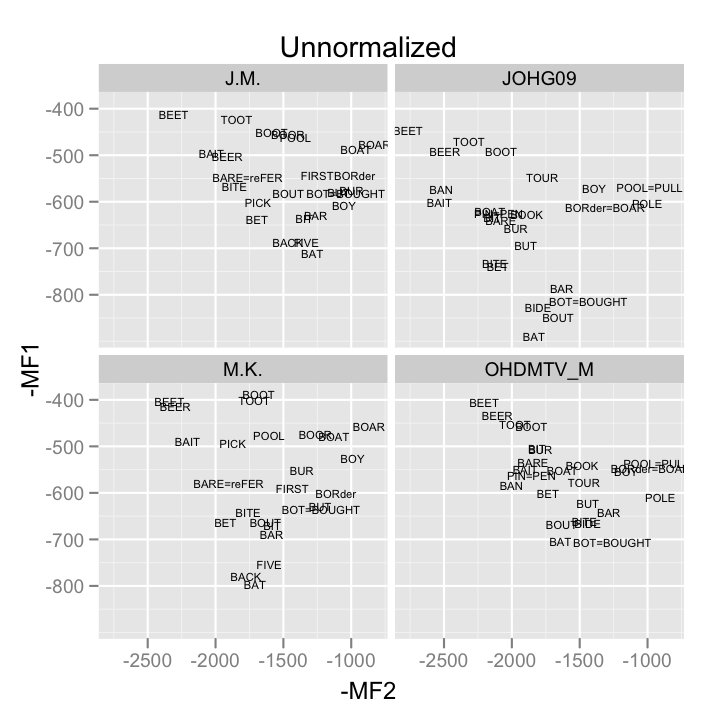
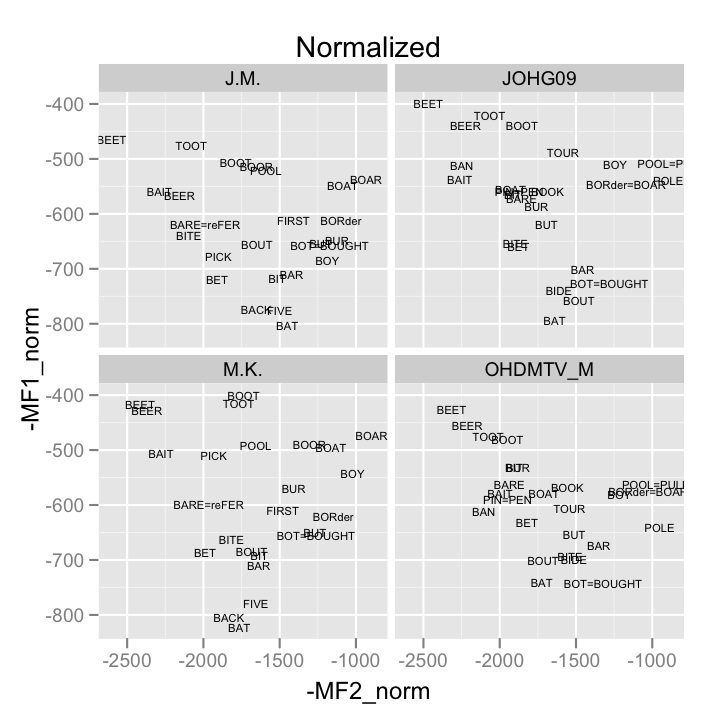
We can test this function out using some data from the SLAAP project's NORM sample data sets.
## read in the data
samp <- read.delim("http://ncslaap.lib.ncsu.edu/tools/norm/downloads/CentralOhioAndTyrone.txt")
## apply the function
samp_norm <- ddply(samp, .(speaker), AnaeNormalize)
## Examine normalization efficacy
## Step 1: Produce means
samp_means <- ddply(samp_norm, .(speaker, vowel.frame), summarize, MF1 = mean(F1), MF2 = mean(F2), MF1_norm = mean(F1_norm), MF2_norm = mean(F2_norm))
## Step 2: Plot them
unnorm <- qplot(-MF2, -MF1, data = samp_means, geom = "text", label = vowel.frame, size = I(2), main = "Unnormalized")+ facet_wrap(~speaker)
norm <- qplot(-MF2_norm, -MF1_norm, data = samp_means, geom = "text", label = vowel.frame, size = I(2), main = "Normalized")+ facet_wrap(~speaker)
print(unnorm)
print(norm)
Models example
As a demonstration of the various things you can do with
First, I need to define a function.
fitBuckModels <- function(df){
  mod <- glm(DepVar ~ Freq.z, data = df, family = binomial)
  return(mod)
}
Next, load the buckeye data.
buck <- read.csv("http://www.ling.upenn.edu/~joseff/rstudy/data/sbuck.csv")
## zscore the frequency
buck$Freq.z <- (buck$Log_Freq - mean(buck$Log_Freq)) / sd(buck$Log_Freq)
I'll store every model fit in a list, so I'll need to use
buck_models <- dlply(buck, .(Speaker), fitBuckModels, .progress = "text")
buck_models[1]
Now, I'll access each of those models, and extract their coefficients.
buck_coefs <- ldply(buck_models, coef)
Hadley Wickham's Suggestions
Hadley Wickham (author of he
- Extract a subset of the data for which it is easy to solve the problem.
- Solve the problem by hand, checking results as you go.
- Write a function that encapsulates the solution.
- Use the appropriate plyr function to split up the original data, apply the function to each piece and join the pieces back together.