Linguistics 525
Computational Analysis and Modeling of Biological Signals and Systems
Homework 3
Due: 2/21/2020
Computational Analysis and Modeling of Biological Signals and Systems
Homework 3
Due: 2/21/2020
Linear Shift-Invariant Systems
Section A: One-Dimensional Signals
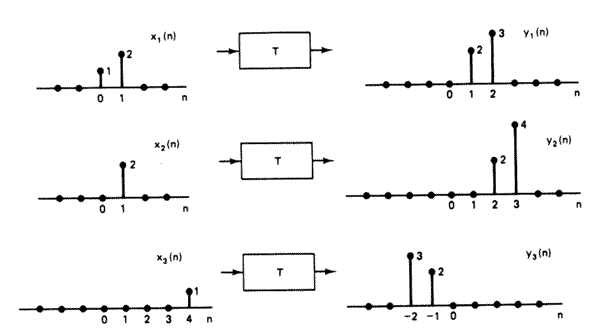
- (Oppenheim and Shafer 1989 p. 68). The system T in the figure
below is known to be time-invariant. When the inputs to the system
are x1[n], x2[n] and x3[n], the responses of the system are y1[n],
y2[n], y3[n] respectively.
- Could the system T be linear? Explain.
- If the input x[n] to the system T is delta[n] (i.e. a unit impulse at time 0), what is the system response y[n]?
- Determine all possible inputs x[n] for which the response of the system T can be determined from the given information alone.
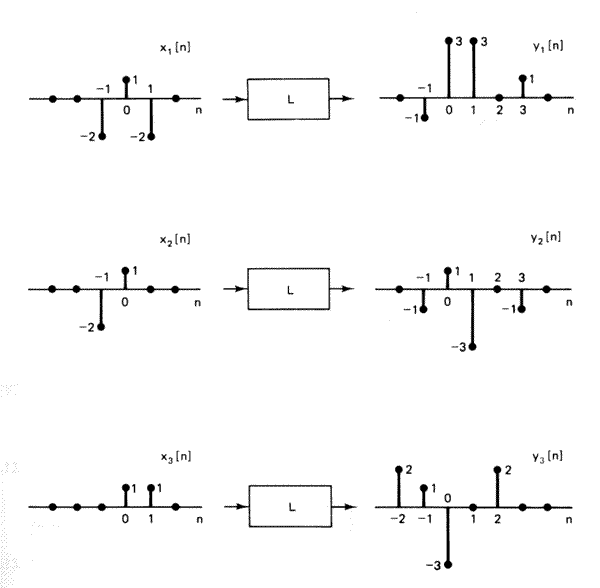
- (Oppenheim & Shafer 1989 p. 69) The system L in the figure
below is known to be linear. When the inputs to the system are
x1[n], x2[n], x3[n], the response is y1[n], y2[n], y3[n]
respectively.
- Could the system L be time-invariant? Explain.
- If the input x[n] to the system is delta[n], what is the system response?
- Create a vector of length 24 containing an impulse at location 5, a step edge at location 12, and a unit-slope ramp starting from location 18. Convolve this signal with the ``two-point averager'': [0.5, 0.5], and the ``two-point differencer'': [0.5,-0.5]. How does the differencer respond to the various features?
- Show that the two convolution results computed above may be added together to reconstruct the original signal. Would this be true for an arbitrary input signal? Why or why not?
- Write an Octave function mksine to construct a vector of samples of a sine function. The function should take arguments size, period, amplitude, and phase. The phase should be measured from the first sample (that is, the first sample is at the origin). Plot a couple of examples to check that your code is working.
- Compute the convolution of each of two 24-sample sinusoids of period 24 and period 4 with the two filters described above (the "two-point averager" and the "two-point differencer". Note the amplitude of the results. What can we conclude about this ``decomposition''?
- Construct a matrix that will represent the action of a shift-invariant linear system (the non-zero elements of) whose impulse response is [1 2 3]', on an arbitrary seven-element input vector. (Hint: the input vector will have the dimensions 7x1; the matrix will thus have to have the dimensions Nx7, where 'N' is chosen so that the result will have the right size for the consequences of convolving a seven-element vector (the input) with a three-element vector (the impulse response).
- Write an Octave function that will imitate the basic behavior of the built-in function conv(a,b), but will accomplish it by constructing a matrix M out of 'b' and then multiplying 'a' by M. How does 'b' appear in the rows and columns of M?
Section B: Two-Dimensional Signals
- Download images.mat to an appropriate
place and execute load("images.mat"),
thereby creating variables albert
and ronald. You can display
them with e.g. imagesc(albert);
colormap(gray) .
[If Matlab complains, try images1.mat, which is in Matlab v7 binary format. And if your version of Octave/Matlab displays the pictures upside down, try e.g. imagesc(flipud(albert)).]
Compute a 3-point horizontal weighted average of albert using the kernel [ 0.25 0.5 0.25 ]. Compute a similar 3-point vertical average.
[For this and the next couple of questions, use the builtin function conv2() .]
- Now convolve with both filters (sequentially). What equivalent single 2D convolution would produce the same result? Give the convolution kernel, and show that the result is the same.
- The result of this convolution may not look so different from the original, but try subtracting it from the original. What equivalent single 2D convolution would have produced this result?
- Take the result of the previous question (difference of original
and average -- call it 'I'), and compute the following binary image:
Could we have computed it via a single convolution?
- Write a function mksine2 that constructs an array of samples from a 2D sine wave. This function should take similar arguments to the function in question 5, but will require both xsize and ysize, and should also take an angular argument direction specifying the normal direction of the sine wave. Use imagesc( ) to check your work.