Linguistics 520: Diving into R
1. Getting Started
Download http://babel.ling.upenn.edu/courses/ling520/SwitchboardDurations to a folder where R will find it (remember setwd()?). You can do this in R via
download.file("http://ling.upenn.edu/courses/ling520/SwitchboardDurations.rda","SwitchboardDurations.rda")
Then in R, execute
load("SwitchboardDurations.rda")
This will give you several variables, crucially WordDurs, Call2Caller, and CallerInfo, created from the Mississippi State revisions of the aligned Switchboard transcripts. In a later exercise, we'll look at the process of generating this R-accessible form of the data.
WordDurs has 4,051,206 rows and 8 columns, like this:
CallPos  Call PhrasePos BPhrasePos PLength Duration      Word     Nonlex
1       2001a     0          0       0     0.977625   [silence]      1
2       2001a     0          0       0     0.237625   [silence]      1
3       2001a     1          1       1     0.509375          hi      0
4       2001a     0          0       0     0.549000   [silence]      1
5       2001a     1          1       1     0.654000          um      0
6       2001a     0          0       0     0.293875   [silence]      1
7       2001a     1          6       6     0.440250        yeah      0
8       2001a     2          5       6     0.295875         i'd      0
9       2001a     3          4       6     0.150000        like      0
10      2001a     4          3       6     0.160000          to      0
11      2001a     5          2       6     0.260000        talk      0
The columns are:
CallPos -- position in the current side of the current call
Call -- ID of call (number) and side (a or b)
PhrasePos -- Count from the start of the phrase, where "phrase" is "sequence between silences"
BPhrasePos -- Count from the end of the phrase
PLength -- Length of the current phrase
Duration -- in seconds
Word -- The current word, in standard English spelling, or [silence], [noise], [laughter] etc.
NonLex -- 1 if "Word" is [silence] or [noise] or other non-speech material, 0 for "real speech"
This allows you to execute some lines like this:
whichum = (WordDurs[,"Word"] == "um")
whichuh = (WordDurs[,"Word"] == "uh")
meanUM = mean(WordDurs[whichum,"Duration"])
meanUH = mean(WordDurs[whichuh, "Duration"])
cat(sprintf("Mean UM Duration %.3f (of %d)\nMean UH Duration %.3f (of %d)\n",
    meanUM, sum(whichum),meanUH, sum(whichuh)))
...giving you this result:
Mean UM Duration 0.431 (of 21187)
Mean UH Duration 0.306 (of 69814)
Call2Caller has 4876 rows like this:
          CallID CallerID
   4630b  4630b     1690
   4718a  4718a     1690
   4825b  4825b     1690
   4812b  4812b     1691
   4629b  4629b     1650
   4703b  4703b     1650
   4618b  4618b     1651
   4655b  4655b     1651
   4216a  4216a     1610
   4241a  4241a     1610
CallerInfo has 543 rows like this:
       ID Sex Age Calls        Region
1000 1000   F  37     1 SOUTH_MIDLAND
1001 1001   M  51     3       WESTERN
1002 1002   F  28     2      SOUTHERN
1003 1003   M  44     2 NORTH_MIDLAND
1004 1004   F  33     2      NORTHERN
1005 1005   F  35     2       WESTERN
1007 1007   F  26     2   NEW_ENGLAND
1008 1008   F  52     1         MIXED
1010 1010   M  59     1   NEW_ENGLAND
1011 1011   F  27     2 SOUTH_MIDLAND
The other variables include these 4,051,206-element vectors derived from these for convenience, e.g.
Calls = WordDurs[,"Call"]
Callers = Call2Caller[Calls,2]
You may find it worthwhile to define some other similar vectors, e.g.
Speech = !WordDurs[,"Nonlex"]
... for reasons that will become clear below.
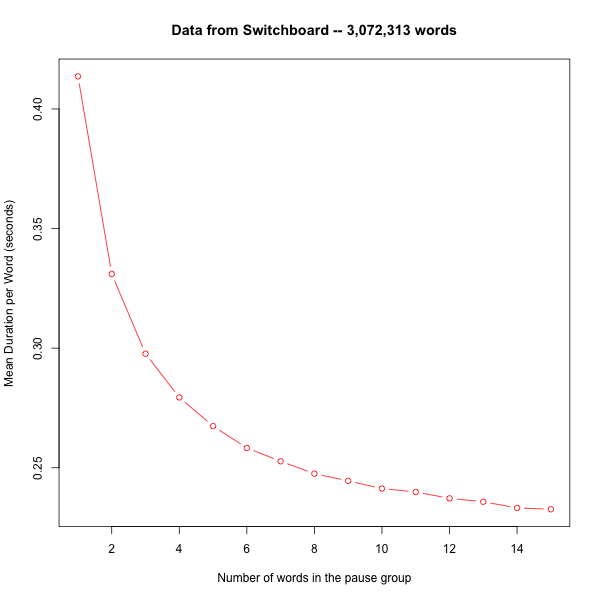
2. A simple plot
Let's look at mean word duration as a function of phrase length:
PLength = WordDurs[,"PLength"]
MeanDurs = vector(mode="numeric", length=15)
for(n in 1:15){
   which = ((PLength==n) & speech)
   MeanDurs[n] = mean(WordDurs[which,"Duration"])
}
plot(1:15,MeanDurs, xlab="Number of words in the pause group",
   type="b", col="red",
   ylab="Mean Duration per Word (seconds)",
   main="Data from Switchboard -- 3,072,313 words")
This yields:
3. R assignment #1 -- Due Monday 11/10/2014:
(1) Calculate the mean word duration by position for phrase lengths from 1 to 12. If everything works out, this should give you numbers and plots like those in "The shape of a spoken phrase", 4/12/2006.
(2) Do speaking rates change in the course of a conversation? Devise one or more ways to evaluate this question, and implement at least one of them.
If you don't know how to do something, try Googling it (e.g. cumulative sum in R, which will allow you to turn a vector of durations into a vector of end/start times), or reading the first few chapters of this tutorial.