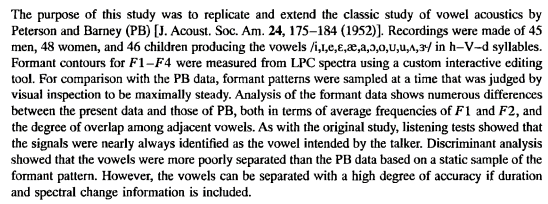
From James Hillenbrand, Laura Getty, Michael Clark, and Kimberlee Wheeler, "Acoustic Characteristics of American English Vowels", JASA 97(5) 1995:
Here is their plot of all (45+48+46)*12 = 1668 vowels, in F1/F2 space, characterizing each vowel by means of one set of formant values representing the spectrum at one time-point chosen as typical:

As the plot shows, these vowel regions in F1/F2 space are highly overlapped. In her April 2010 Pinkel Lecture, Pat Kuhl suggests that our ability to hear vowel categories, and especially to learn them, is therefore rather mysterious:
So when Bill Gates looks at the problem with his computers, this is what he sees. Now we're going to take formant one and formant two, if you don't know anything about the acoustics of sounds, of speech sounds, a vowel like Ah, is like a chord on the piano. The notes compose a chord, a unified chord. The formant frequencies, F1, F2, when put together with three other formants produce a vowel. But the problem is there's huge variability. So these are data taken from a number of different speakers where each symbol in here, these are phonetic symbols, each one is a different talker.
You can see the huge variability and overlap in the vowels of English. So you're going to [speaks the vowel progression] in this graph. But the problem is if you're a computer, the acoustic physical measurement itself doesn't tell you which vowel it is because the overlap is so profound. Right? And this is in isolated utterances; it's not in running speech like I'm doing. So you can see why we're not all typing into--and we're all still typing into our computers instead of using a xsmicrophone. If this problem had been solved by Microsoft or any other software company we would have long ago dispensed with the keystrokes. We would be talking into computers and controlling devices with our voices. But that's not a reality in spite of millions of dollars being thrown at that problem.
Now the other thing that's interesting from the standpoint of language development is this same vowel triangle is used across all languages. So Swedish shoves 16 vowels in this space. And it's really a minefield to look at the production of Swedish speakers. Japan's does as well only with 5 vowels and Spanish with 5 vowels. But they also show, we're as sloppy as we can be so Japanese speakers will use the whole space and show overlap even in their 5 vowels. They don't make it easier for the kids to acquire by speaking a language that uses fewer vowels.
So herein lies the problem. The babies have the ability to hear fine distinctions when you isolate everything in a carefully controlled experiment. But in the real world they're hearing all this variability and have to in order to learn words. Decide how many categories does my language use and which ones are they.
There are a few problems with this perspective. In the first place, as explained in class, when (someone that) Bill Gates (hires to work on speech recognition), the chances are that he or she doesn't look at a single point in two- or three-dimensional formant space, but rather at a sequence of spectral values in a higher-dimensional representation, say via a dozen or so MFCC coefficients for each spectrum. Thus a half-second-long vowel might be characterized by something like 12*50 = 600 numbers, not three numbers.
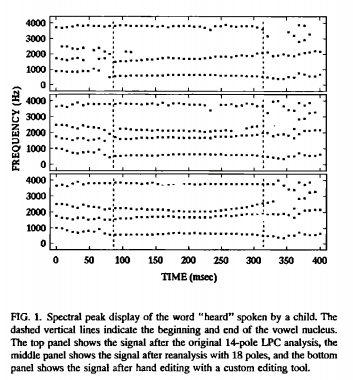
The reason that formants are not used can be inferred from this passage in the Hillenbrand et al. paper:
Formant-frequency analysis began with the calculation of 14-pole, 128-point linear-predictive code (LPC) spectra every 8 ms over 16 ms (256 point) hamming windowed segments. The frequencies of the first seven spectral peaks were then extracted from the LDC spectrum files. [...] Files containing the LPC peak data served as the input to a custom interactive editor. The editor allows the experimenter to reanalyze the signal with ifferent LPC analysis parameters and to hand edit the formant tracks.
Editing and analysis decisions were based on an examination of the LPC peak display overlaid on a gray-scale spectrogram and, in some cases, on an examination of individual LPC or Fourier spectral slices. General knowledge of acoustic phonetics also played a role in the editing process. For example, editing decisions were frequently influenced by the experimenters knowledge of the close proximinty of F2 and F3 for [certain vowels], the close proximity of F1 and F2 for [certain other vowels], and so on. [...] Considerations such as these often led the experimenter to conclude that a formant merger occurred. In these cases, the LPC spectra were recomputed with a larger number of poles until the merged formants separated.
Once the experimenter was satisfied with the analysis, editing commands could be used to hand edit any formant tracking errors that remained. Figure 1 shows an example of the utterance "heard" spoken by a ten-year-old boy: 9a) after the original 14-pole analysis, (b) after reanalysis with 18 poles, and (c) after hand-editing. [...]
It was not uncommon for utterance to show formant mergers throughout all or part of the vocalic nucleus that could not be resolved using these methods. In these cases, zeros were written into the the higher of the two formant slots showing the merger.
For example, 10% of /i/ vowels and 9.3% of /e/ vowels showed F2/F3 merger, even after all of the reanalysis and hand editing.
The original Hillenbrand vowel data is on line here, including the original digital audio recordings as well as their edited formant analysis files.
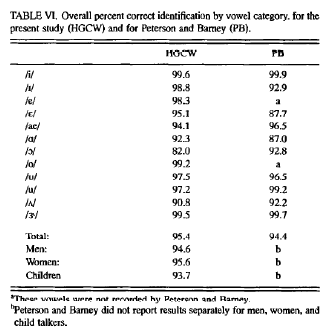
Although their vowel categories overlap considerably in F1/F2 space, the individual tokens were quite well identified by human listeners: 95.4% correct overall.
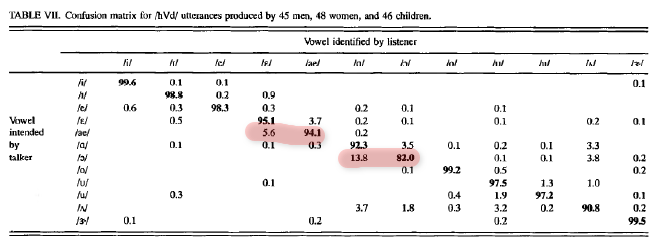
And far from being entirely random, the errors involved the expected confusions, such as /ɛ/ for /æ/ and /ɑ/ for /ɔ/:
If the human identification performance were solely based on the single-point F1/F2 data shown in the figure above, this would indeed be mysterious. But in fact the human listeners are getting a whole spectral trajectory, not just a single point; and they're getting a richer representation of the spectra in this trajectory than just two formant values; and they have some extra information from the duration of the vowel (since some of these American English vowels are typically longer than other) and from the pitch (since this gives a clue about the man/woman/child distinction).
Given this additional information, the human recognition performance on this data becomes substantially less mysterious. Hillenbrand et al. show that a statistical classifier with three time-samples of the formant-space trajectory, and with duration and pitch information added, performs slightly better than the human listeners did:
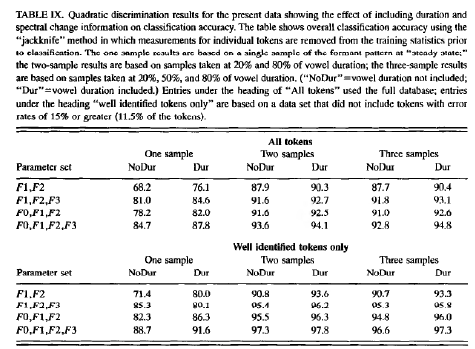
Here's a replication, using a somewhat different type of statistical classifier (based on Mahalanobis distances), and a slightly different cross-validation scheme (leaving out one speaker at a time rather than one vowel at a time), and perhaps a slightly different data subset (leaving out vowels with missing formant data).
OHill1.R: Gaussian classifier based on "steady state" formant values -- 81.4%
OHill1n.R: ditto with Lobanov speaker normalization -- 93.5%
OHill1nc.R: ditto with leave-one-out cross validation -- 92.3%
OHill3.R: Gaussian classifier based on formant values at 30% and 70% of vowel duration --94.0%
OHill3n.R: ditto with Lobanov speaker normalization -- 98.2%
OHill3nc.R: ditto with leave-one-out cross validation -- 97.1%
(These R scripts make use of a re-presentation of the formant, duration, and pitch data from Hillenbrand et al.: bigdata2.dat. To get started with the same things in Matlab, Hill.m shows you how to read in the data and get read to train/test.)
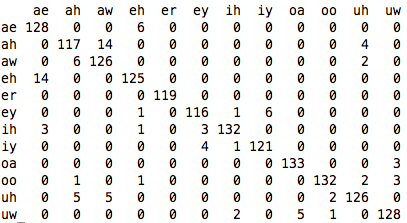
The confusion matrix from OHill3.R:
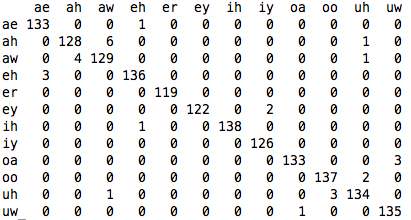
The confusion matrix from OHill3n.R:
This leaves two loose ends, one looser than the other.
First, can we replicate this result without "cheating" by using hand-corrected "formant" values which incorporate the experimenters' knowledge of what was said and expectations about what the corresponding values should be? The short answer is "yes" -- if you want to try for yourself, Xbiggerdata.dat has MFCCs for 8-kHz versions of the Hillenbrand data, with columns arranged as follows:
# col1: file prefix
# col2 to col13: mfccs at 20%
# col14 to col25: mfccs at 50%
# col26 to col37: mfccs at 80%
# col38: duration in msec
# col39: f0 at "steady state"
# col40: 1=man 2=woman 3=boy 4=girl
# col41: 1=ae 2=ah 3=aw 4=eh 5=er 6=ey
# 7=ih 8=iy 9=oa 10=oo 11=uh 12=uw
# col42: unique speaker ID, 1 to 139
Second, can we induce this vowel classification without labelled "training data", just by observing the distribution of points in (some transformation of) this multidimensional spectro-temporal space? In this case, the answer is somewhere between "no" and "sort of" -- but the partial success points in the direction of a possible solution.