Investigation of Fundamental Frequency (2)
Linguistics 521: Overall F0 trends at syllable and phrase scale
In Liberman & Pierrehumbert 1984, we gave this pitch track of an example from a radio talk show:

And we followed it with this plot of a collection of such phrases time-normalized and averaged:

In that paper, we argued against the view that such f0 downtrends are simply the consequence of some natural physiological properties of speaking, such as the typical profile of subglottal pressure in a "breath group", or the effect of decreasing lung volume pulling on the larynx. And we also argued against other theories that posit a pre-planned rate of f0 decline that varies with phrase length, suggesting instead that observed downtrends are the result of three time-local effects: phrase-initial raising; phrase-final lowering; and a local "downstep" effect triggered by certain tonal sequences.
More broadly, we investigated the scaling (in laboratory speech) of specific types of f0 contours under changes in pitch range (generated by changes in vocal effort) and utterance length. We found that local f0 relationships remain nearly constant if they are expressed on a scale determined by the speaker "baseline" f0, the current bottom of the speaker's pitch range. This scale has both an additive and a multiplicative component: "baseline units above the baseline". Read the paper to follow our arguments.
In Yuan & Liberman 2014, we looked at published collections of English and Mandarin broadcast news, divided into phrases by automated segmentation (at silent pauses) of forced alignment of the transcript with the audio -- 5652 English phrases from 73 speakers and 8383 Mandarin phrases from 27 speakers.
We fit regression lines to the overall f0 contours phrase by phrase; as others have found in smaller datasets of read speech, the overall regression slope depended on phrase length, with longer phrases having smaller slopes:

Mandarin had larger mean slopes at each utterance length, and correspondingly a larger fraction of Mandarin phrases had a negative regression slope (90.7% of all phrases) compared to English phrases (71.5%). This might reflect an overall difference between the languages, but it's important to recognize that it might also be a cultural difference in the style of broadcast news reading (though there were 73 speakers from 4 different sources for the English broadcasts, and 27 speakers from 3 different sources for the Chinese broadcasts).
Some of the phrase-length effect comes from initial raising and final lowering, which have more of an effect on short phrases, as L&P 1984 pointed out. However, there was also a trend in this broadcast news data for initial raising to be greater for longer utterances, which would tend to reduce the overall slope effect. (There was no systematic difference in final lowering for utterances of different lengths.)

When we looked separately at the slopes for the middle portion of phrases at least 2 seconds long, even excluding the first and last 500 msec., there was still a tendency for slopes to decrease with phrase length:

This suggests that argument in L&P 1984 about (the lack of) phrase-level pre-planning was at least incomplete.
We also found "top" and "bottom" lines for the phrasal contours, by smoothing the f0 and choosing peaks and valleys based on a convex hull algorithm:

We found that the downtrends of the toplines (the peaks) and the bottom lines (the valleys) were roughly parallel when expressed on a semitone (ratio) scale. Thus this method did not reveal the additive component found in the L&P 1984 experiments:

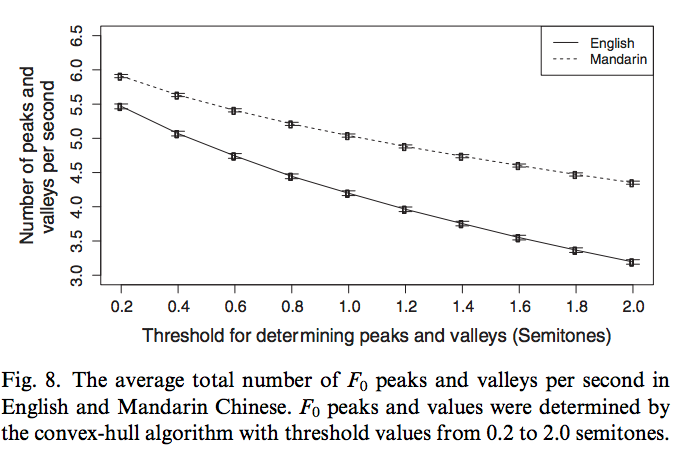
The density of peaks and valleys depends in such f0 tracks depends on how "peaks" and "valleys" are defined. Depending on how we set the threshold parameter in our algorithm for selecting peaks and valleys, we find a different number -- but at every threshold value, the Chinese broadcast news audio has more f0 peaks per second than the English broadcast news. This is not surprising, given the tonal nature of Mandarin Chinese and the subjective impression of greater variability in Chinese as opposed to English speech:
To explore some other ways to calculate and display overall properties of f0 estimates in speech corpora, let's take a look at an interview on the NPR program Fresh Air ("Lena Dunham On Sex, Oversharing And Writing About Lost 'Girls'", 930/2014). You can find the audio and .trs and .textgrid files in harris.sas.upenn.edu:/plab/FreshAir/LenaDunham. I pitch-tracked the whole audio file using get_f0a, and divided the resulting file into two sequences, one for the host and the other for the guest.
The overall pitch ranges are similar are similar, though it seems that Terry Gross has a bit more variation -- her quantiles from 60% to 95% are somewhat higher, while her quantiles from 10% to 45% are somewhat lower. The dip in Lena Dunham's 5th percentile is probably due to a greater amount of phrase-final creaky voice/vocal fry:
 ;
;
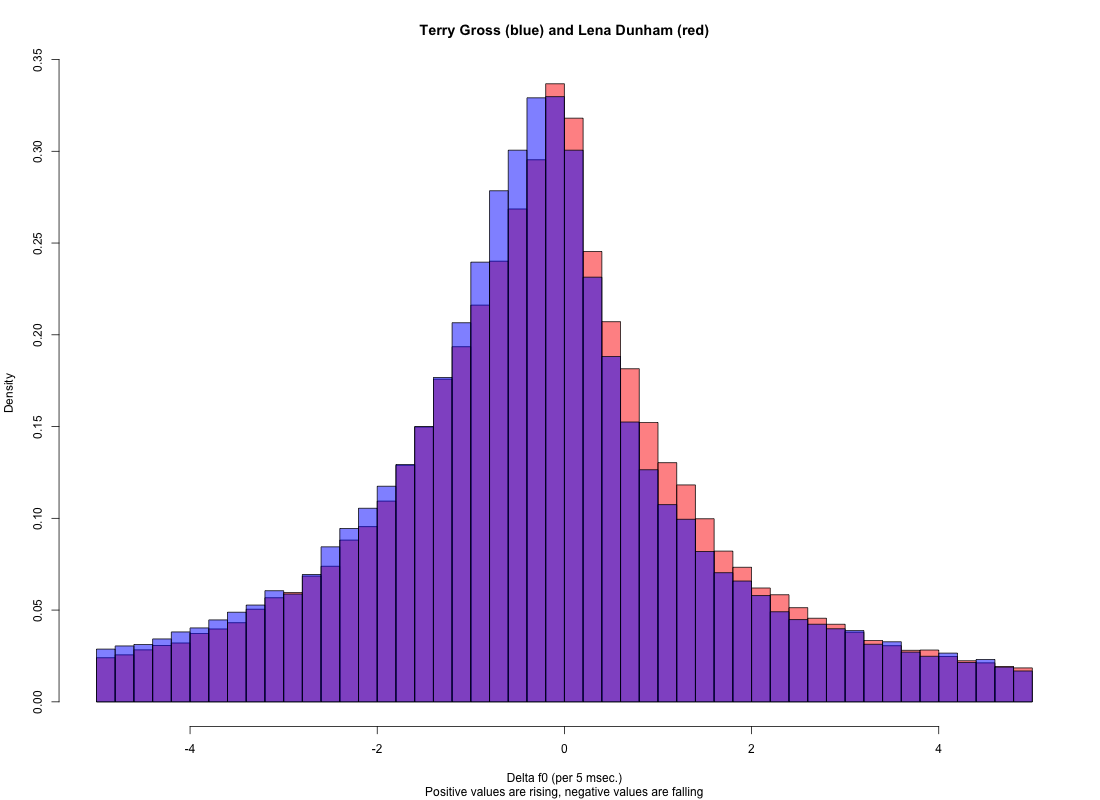
The distribution of short-term (frame-to-frame) f0 changes is also similar, though it seems that Terry Gross has a slightly larger proportion of falls, and Lena Dunham a slightly larger proportion of rises:
 ;
;
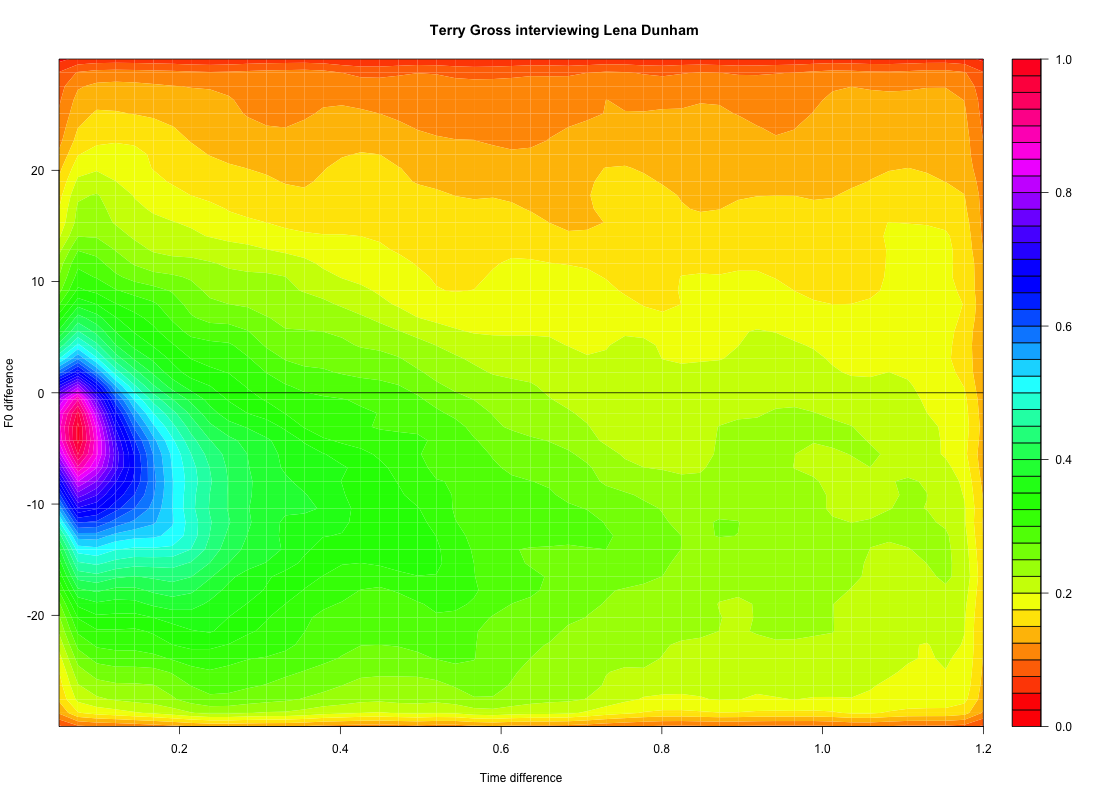
We can explore the local f0 shape more systematically by looking at dipole statistics. To do this, we do a separate density plot of f0 differences at each possible time separation over a range of interest, and plot the results as a three-dimensional graph where the x axis is the difference in time, the y axis is the difference in f0, and the z axis is the density estimate (essentially the smoothed histogram) for that combination of time and f0 differences. Here's a plot showing Terry Gross's f0 dipole density at the scale of syllables -- 0 to 200 milliseconds. You can see that in her local f0 relationships, the second value is mostly lower than the first one, by an amount that tends to increase as the time difference increases.
 ;
;
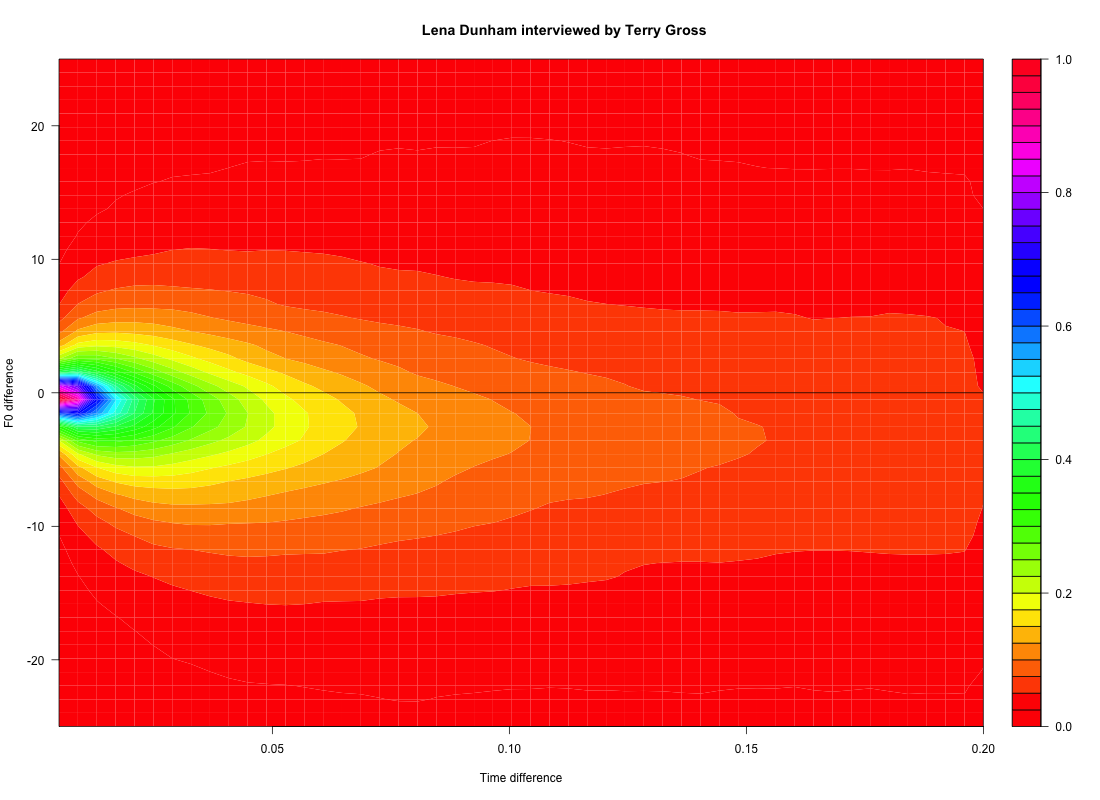
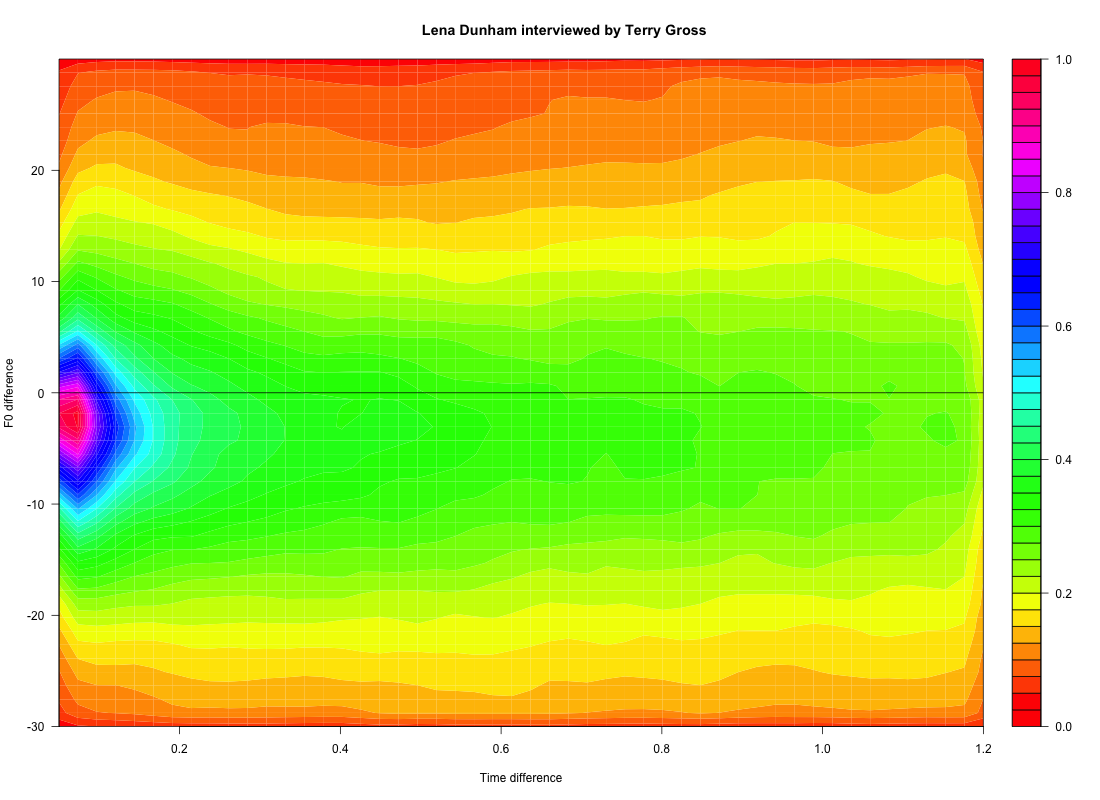
The same plot for Lena Dunham's material shows a similar general downard trend, but distinctly weaker:
 ;
;
Although I've described these dipole plots as calculated over syllabic time scales, it's important to note that no segmentation (syllabic or otherwise) was involved. The interview chosen as an example was 44:58.19 long. After eliminating some reading and some other non-interview material, there remained 119,645 f0 analysis frames from Terry Gross's speech, and 345,204 analysis frames from Lena Dunham's speech. The calculation that produced the two plots above simply iterated through each speaker's material, accumulating all f0 differences at lags of 1 to 40 frames (= lags of 5 to 200 milliseconds).
Similar plots at phrasal scale -- time differences from 0 to 1.2 seconds -- show similar downtrends, and a similar difference between the speakers in the magnitude of those downtrends:
 ;
;
 ;
;
Something to think about: What might be some good ways to reduce these evocative pictures to numbers that could be used to disinguish speakers, or speech styles, or languages, or physiological states or clinical diagnoses?
All the analyses considered so far leave out some crucial issues. Consider the difference between a sequence of syllables on each of which the f0 rises and then falls, vs. a sequences of syllables on each of which the f0 falls and then rises.
These sequences will sound very different -- but (we can design the sequences so that) the f0 statistics will be identical. The difference in the sequences arises only because of the difference in alignment between the f0 contour and the syllable boundaries. Or, since syllable centers in general are amplitude maxima, and syllable boundaries are amplitude minima, we can see this as a phrase relation between f0 contours and amplitude contours.
So we might want to look at ways to characterize the bivariate relationship between f0 and amplitude.
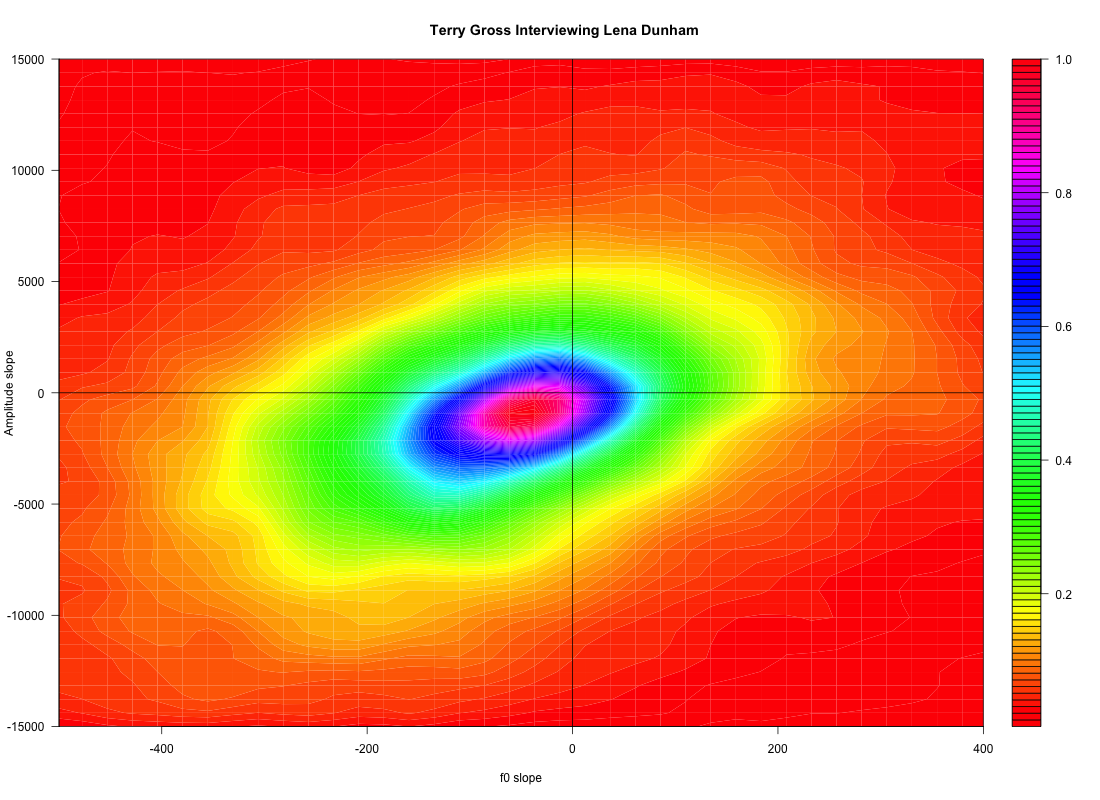
One simple thing to try is just to look at a two-dimensional density plot of local changes in f0 and in amplitude. In order to smooth the contours a bit, and to look at a scale that starts to be perceptually relevant, I calculated the f0 slope and the amplitude slope for all contiguous sequences of 5 voiced analysis frames (25 milliseconds) in the same Fresh Air interview we've been analyzing.
Both speakers show the preponderance of negative-slope f0 estimates at the scale in question, and also a preponderance of negative-slope amplitude estimates.
This is presumably because (the voiced part of) most syllables starts tends to start loud and get softer, and start higher in pitch and get lower.
This suggests that a majority of the increases, both in amplitude and in f0, must be taking place in the unvoiced regions between syllables.
Terry Gross also shows a strong positive correlation of f0 slope and amplitude slope:
 ;
;
Lena Dunham shows a much weaker correlation, and a considerably broader distribution of amplitude slopes overall. It may be that the higher density in the lower right quandrant (rising f0, falling amplitude) reflects a higher proportion of phrase-final rises -- though it might also reflect a tendency for accent peaks to be later:
 ;
;
Given the very large values of N, the differences between the patterns for the two speakers will surely be statistically significant. But it's not clear what they mean. What do they really imply about the distribution of syllable-level f0 and amplitude contours? And are they stable characteristics of the individuals, or just a conequence of the speech style they've adopted for this interview?
And we might want to look for ways to analyze the joint variation in f0, amplitude, spectral balance, measures of aperiodicity such as jitter and shimmer, and so on. Certainly the production and perception of prosody involves modulation of all of these parameters, not just f0.
The point of these notes is not to give you a final prescription for characterizing f0 contours, but to point out that there are many options, even without looking in detail at the relation of such contours to syntax, meaning, discourse structures, communicative context, and conversational relationships.