Linguistics 520: Lab Assignment #3
9/11/2013: Due 9/18/2013
Goals:
1. Learn to transfer Praat segmentations to R for statistical analysis and modeling.
2. Do a simple exercise in R.
3. Verify that your recordings and transcripts are accurate and complete.
At this point you should have a directory with all of your 100 telephone-number-like digits strings in 100 audio file and 100 Praat TextGrid files. But those TextGrid files are in a format that few other programs can make use of:
File type = "ooTextFile" Object class = "TextGrid" xmin = 0 xmax = 4.220498866213152 tiers?size = 1 item []: item [1]: class = "IntervalTier" name = "words" xmin = 0 xmax = 4.220498866213152 intervals: size = 12 intervals [1]: xmin = 0 xmax = 0.5230980666291736 text = "x" intervals [2]: xmin = 0.5230980666291736 xmax = 0.8656992391672517 text = "7"
etc. So download DurationLogger.praat to the directory where your .TextGrid files are, load it into Praat (via the Praat>>Open Praat script... menu item as usual), and make modifications similar to those you performed for the TextGridMaker.praat script, changing
sentence Directory /Users/myl/data/ling520/Lab1/
to give the path to the relevant folder on your machine. (And be sure that there are no other .TextGrid files in that folder -- if there are, then you'll want to move them somewhere else, or create a new folder and copy your 100 digit-measuring TextGrid files there.)
Then run the script -- this should create a file duration_log.txt in the same place, which starts something like this:
Filename        digit   Duration(ms)
Lab1X001        7       342.601
Lab1X001        5       317.533
Lab1X001        2       334.245
Lab1X001        9       294.136
Lab1X001        5       312.549
Lab1X001        5       392.947
Lab1X001        0       391.067
Lab1X001        3       270.738
Lab1X001        5       299.860
Lab1X001        4       462.929
Lab1X002        4       307.443
Lab1X002        2       211.367
[etc....]
This is a format that other programs -- notably R -- can assimilate. So let's do some assimilating.
You should have installed R on your machine already, but if not, get a suitable copy from here. At some point, you should work through one of the many R tutorials on the web. But for today, we're just going to jump into the middle of the pool and start swimming...
So start R in the directory where your duration_log.txt file is located, or after starting R, use the setwd() command to set R's working directory to that place. And download to that same directory the R scripts CheckLab1.R and Lab1.R.
And now run CheckLab1.R, by typing
source("CheckLab1.R")
If all is well, you should see this:
[1] Counts by digit: Should be 100 in each category
 [1] 100 100 100 100 100 100 100 100 100 100
[1] Counts by digit by position: Should be 10 in each category
      [,1] [,2] [,3] [,4] [,5] [,6] [,7] [,8] [,9] [,10]
 [1,]   10   10   10   10   10   10   10   10   10    10
 [2,]   10   10   10   10   10   10   10   10   10    10
 [3,]   10   10   10   10   10   10   10   10   10    10
 [4,]   10   10   10   10   10   10   10   10   10    10
 [5,]   10   10   10   10   10   10   10   10   10    10
 [6,]   10   10   10   10   10   10   10   10   10    10
 [7,]   10   10   10   10   10   10   10   10   10    10
 [8,]   10   10   10   10   10   10   10   10   10    10
 [9,]   10   10   10   10   10   10   10   10   10    10
[10,]   10   10   10   10   10   10   10   10   10    10
[1] If counts are not right, check file 'digits.txt' against reading list
If all is not well, you'll need to do some forensic analysis to figure out what went wrong. Maybe you mis-read a sequence? maybe you mis-typed a label? maybe you missed a digit in labelling? If something went wrong, don't feel bad about it -- I made three or four mistakes in doing this lab myself.
The CheckLab1.R script has written out a file digits.txt which presents its understanding of which digits are where -- my version starts
"V1" "V2" "V3" "V4" "V5" "V6" "V7" "V8" "V9" "V10"
"1" 7 5 2 9 5 5 0 3 5 4
"2" 4 2 2 0 9 3 6 2 5 9
"3" 9 2 1 3 9 7 2 3 8 9
"4" 1 4 5 2 1 5 5 2 3 6
"5" 7 0 1 5 8 9 9 5 8 4
"6" 2 9 1 0 0 5 2 2 8 7
This should be helpful in figuring out where you went wrong. (If there's a problem, and your CSI investigation remains baffled after 20 minutes or so of sleuthing, call in Eric or me...)
Once you've got things in order, run
source("Lab1.R")
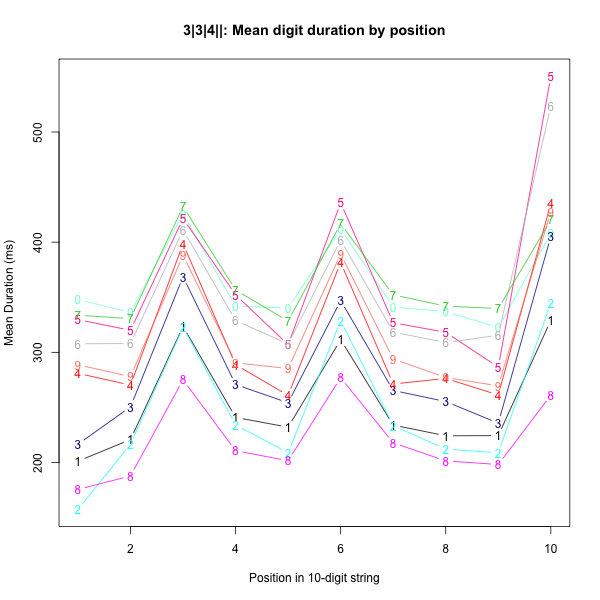
and you should get two plots. The first one will show average duration by digit by position:
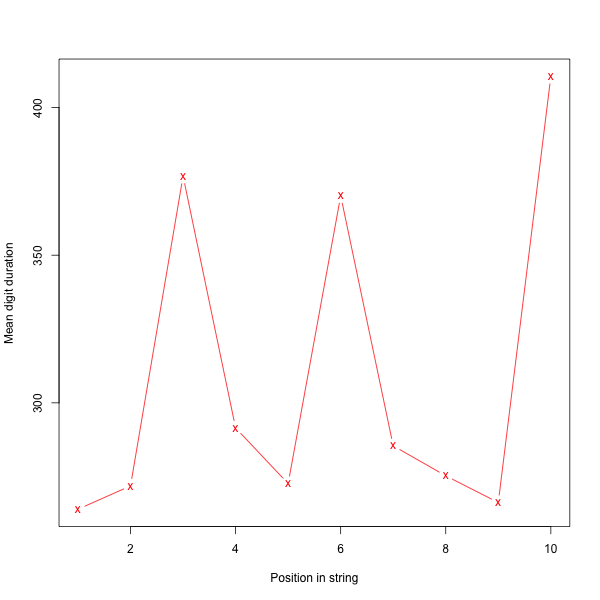
And the second one will show the overall average duration by position, across all digits:
If you want graphics files rather than interactive graphics, download and execute Lab1a.R, and you'll get files Lab1_1.png and Lab1_2.png containing the same pictures.
Now if you execute (in R):
round(dpdurs)
you'll see a table whose rows are digits and whose columns are positions (in the ten-digit string), where cell dpdurs[i,j] contains the average duration (in milliseconds) of digit i in position j (according to your measurements of your pronunciations). Mine looks like this:
    1   2   3   4   5   6   7   8   9  10
0 348 336 426 342 340 412 341 337 323 408
1 201 221 323 241 232 312 234 224 224 329
2 158 216 323 234 209 329 233 212 209 345
3 217 251 369 271 254 347 265 255 236 405
4 281 270 398 289 261 382 271 276 261 435
5 330 320 422 352 307 436 327 318 287 551
6 308 308 411 329 308 402 318 309 315 524
7 334 331 432 357 328 417 352 342 340 420
8 176 188 275 211 202 277 218 201 198 261
9 289 278 388 290 285 389 294 277 270 427
Your assignment: use all of this stuff as raw material for a brief but informative lab report.